Three come at once.
Earlier this year we hosted a student, Christopher Lunny, as part of the Data Lab MSc programme.
October 18, 2016
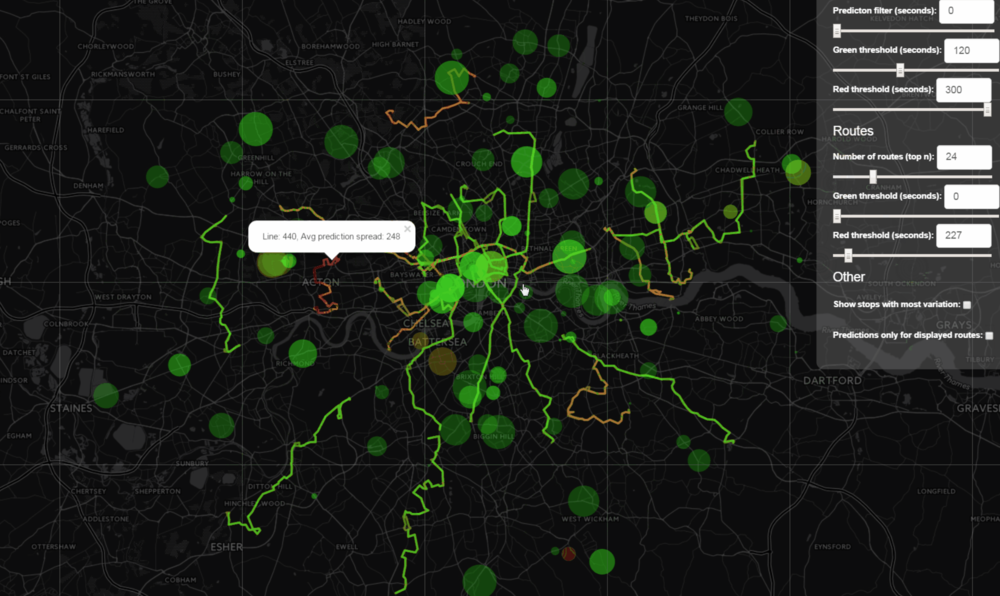
The goal of Christopher's MSc project with us was to test out USMART's real-time data performance using Transport for London Countdown API. We also wanted to answer this question: How well do the buses adhere to their timetables?
Countdown API
The Transport for London Countdown API provides a stream of live bus arrival-time predictions in London with over 19,000 bus stops, over 700 bus routes and over 8,000 buses; there are approximately 130,000 bus arrival-time predictions at any given time and over 12 Million updates to the model per day.
As part of the USMART platform, Christopher used an Apache Cassandra database for data storage which allowed for very fast writes of data over a scale-out architecture of commodity hardware with linear scalability. Apache Spark provided him with the engine for distributed data processing with modules for machine learning, graph processing and real-time processing of streaming data.
Christopher went on to win Data Lab's Best Student award based on the work he did while he was at UrbanTide and we are very proud to have provided the space and support for him to work on such an achievement.
Bus Gap Analysis - then three come at once
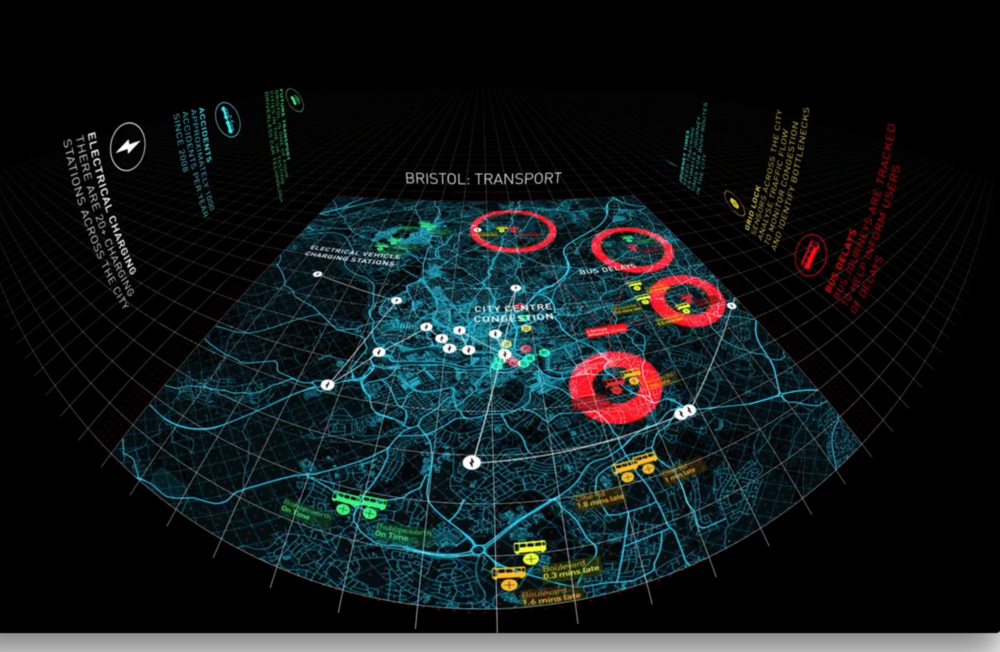
Using the Transport for London data, Christopher wanted to answer this question: how well do the buses adhere to their timetables? Many of the buses are not timetabled to be at specific stops at specific times, especially during peak times. Instead, the timetables indicate expected time gaps between one bus and the next to arrive at a stop, and each stop can have a different waiting time even for the same bus route.
We analysed the performance of one of the bus routes during the peak time to see how long the gaps were between each bus arrival at a particular stop. The findings indicate that in some cases longer than timetabled wait times occurred as did platooning; however the more widespread visualisation of the routes, using big data analytics, shows that bus stop predictions are generally accurate on the vast majority of routes.
As well as Christopher picking up the best project award, we are delighted that Transport for London is interested in this data analysis and visualisation project. Watch this space for updates.
Read more about Christopher's experience working with Urban Tide - Big Data needs Big Brains.
More
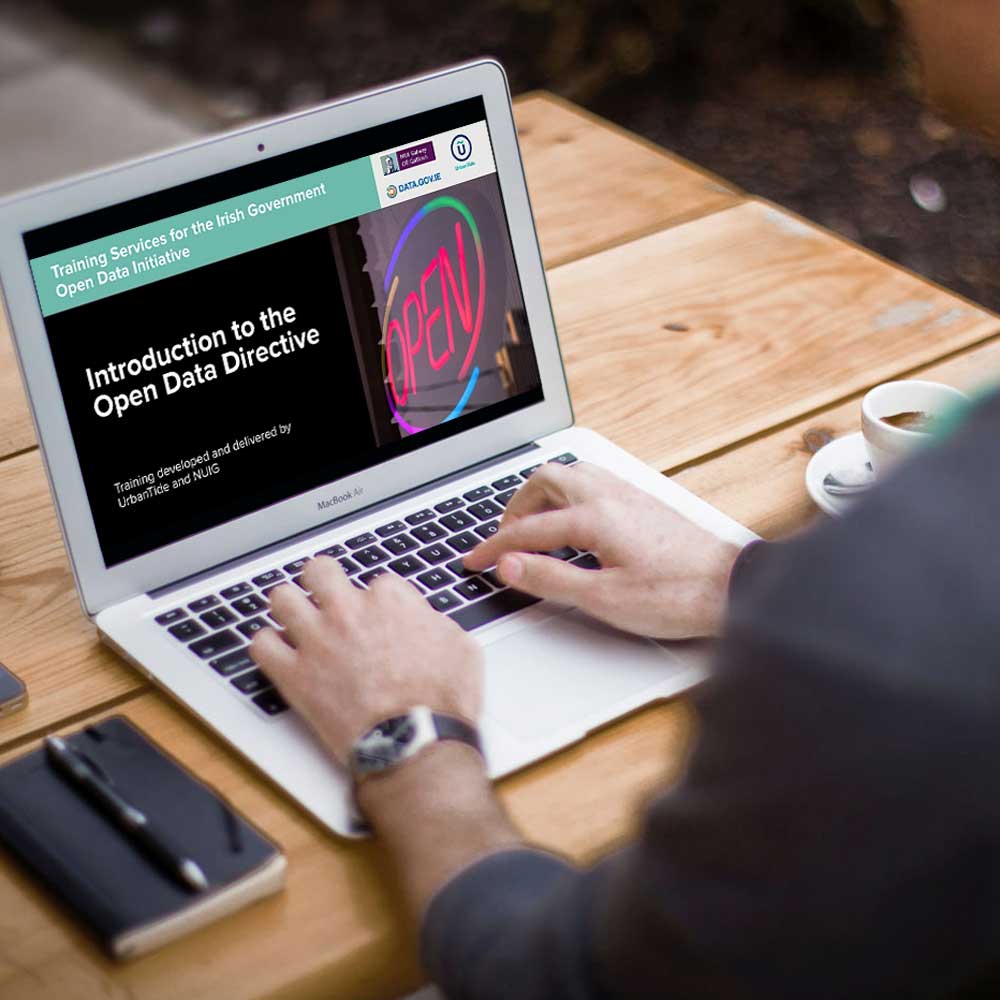
Unlocking Ireland's Data Potential: Navigating the Open Data Directive with UrbanTide
News

UrbanTide's Commitment to Security: Officially ISO 27001 Certified!
News

uZero was awarded the edie Net Zero Innovation of the Year: Software, Systems & Services Award
News

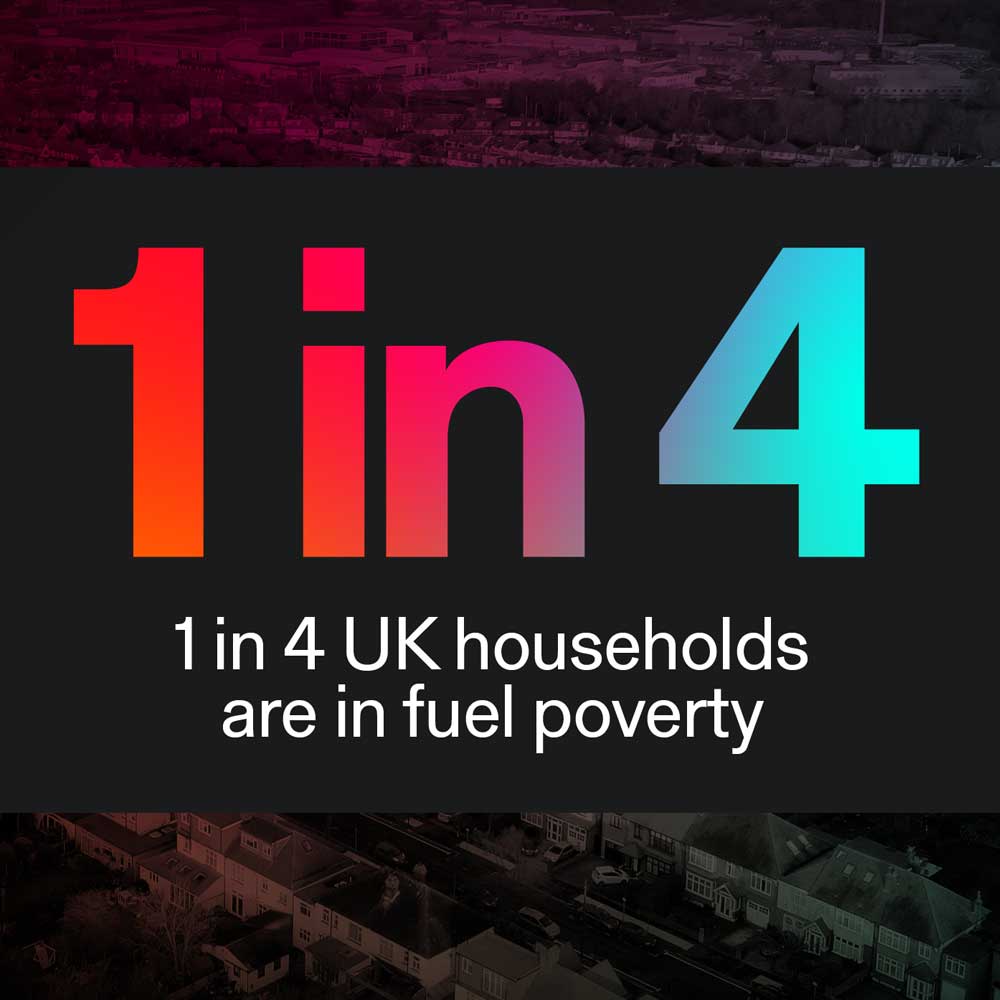
Tackling the growing fuel poverty crisis and supporting the Just Transition to net zero
News

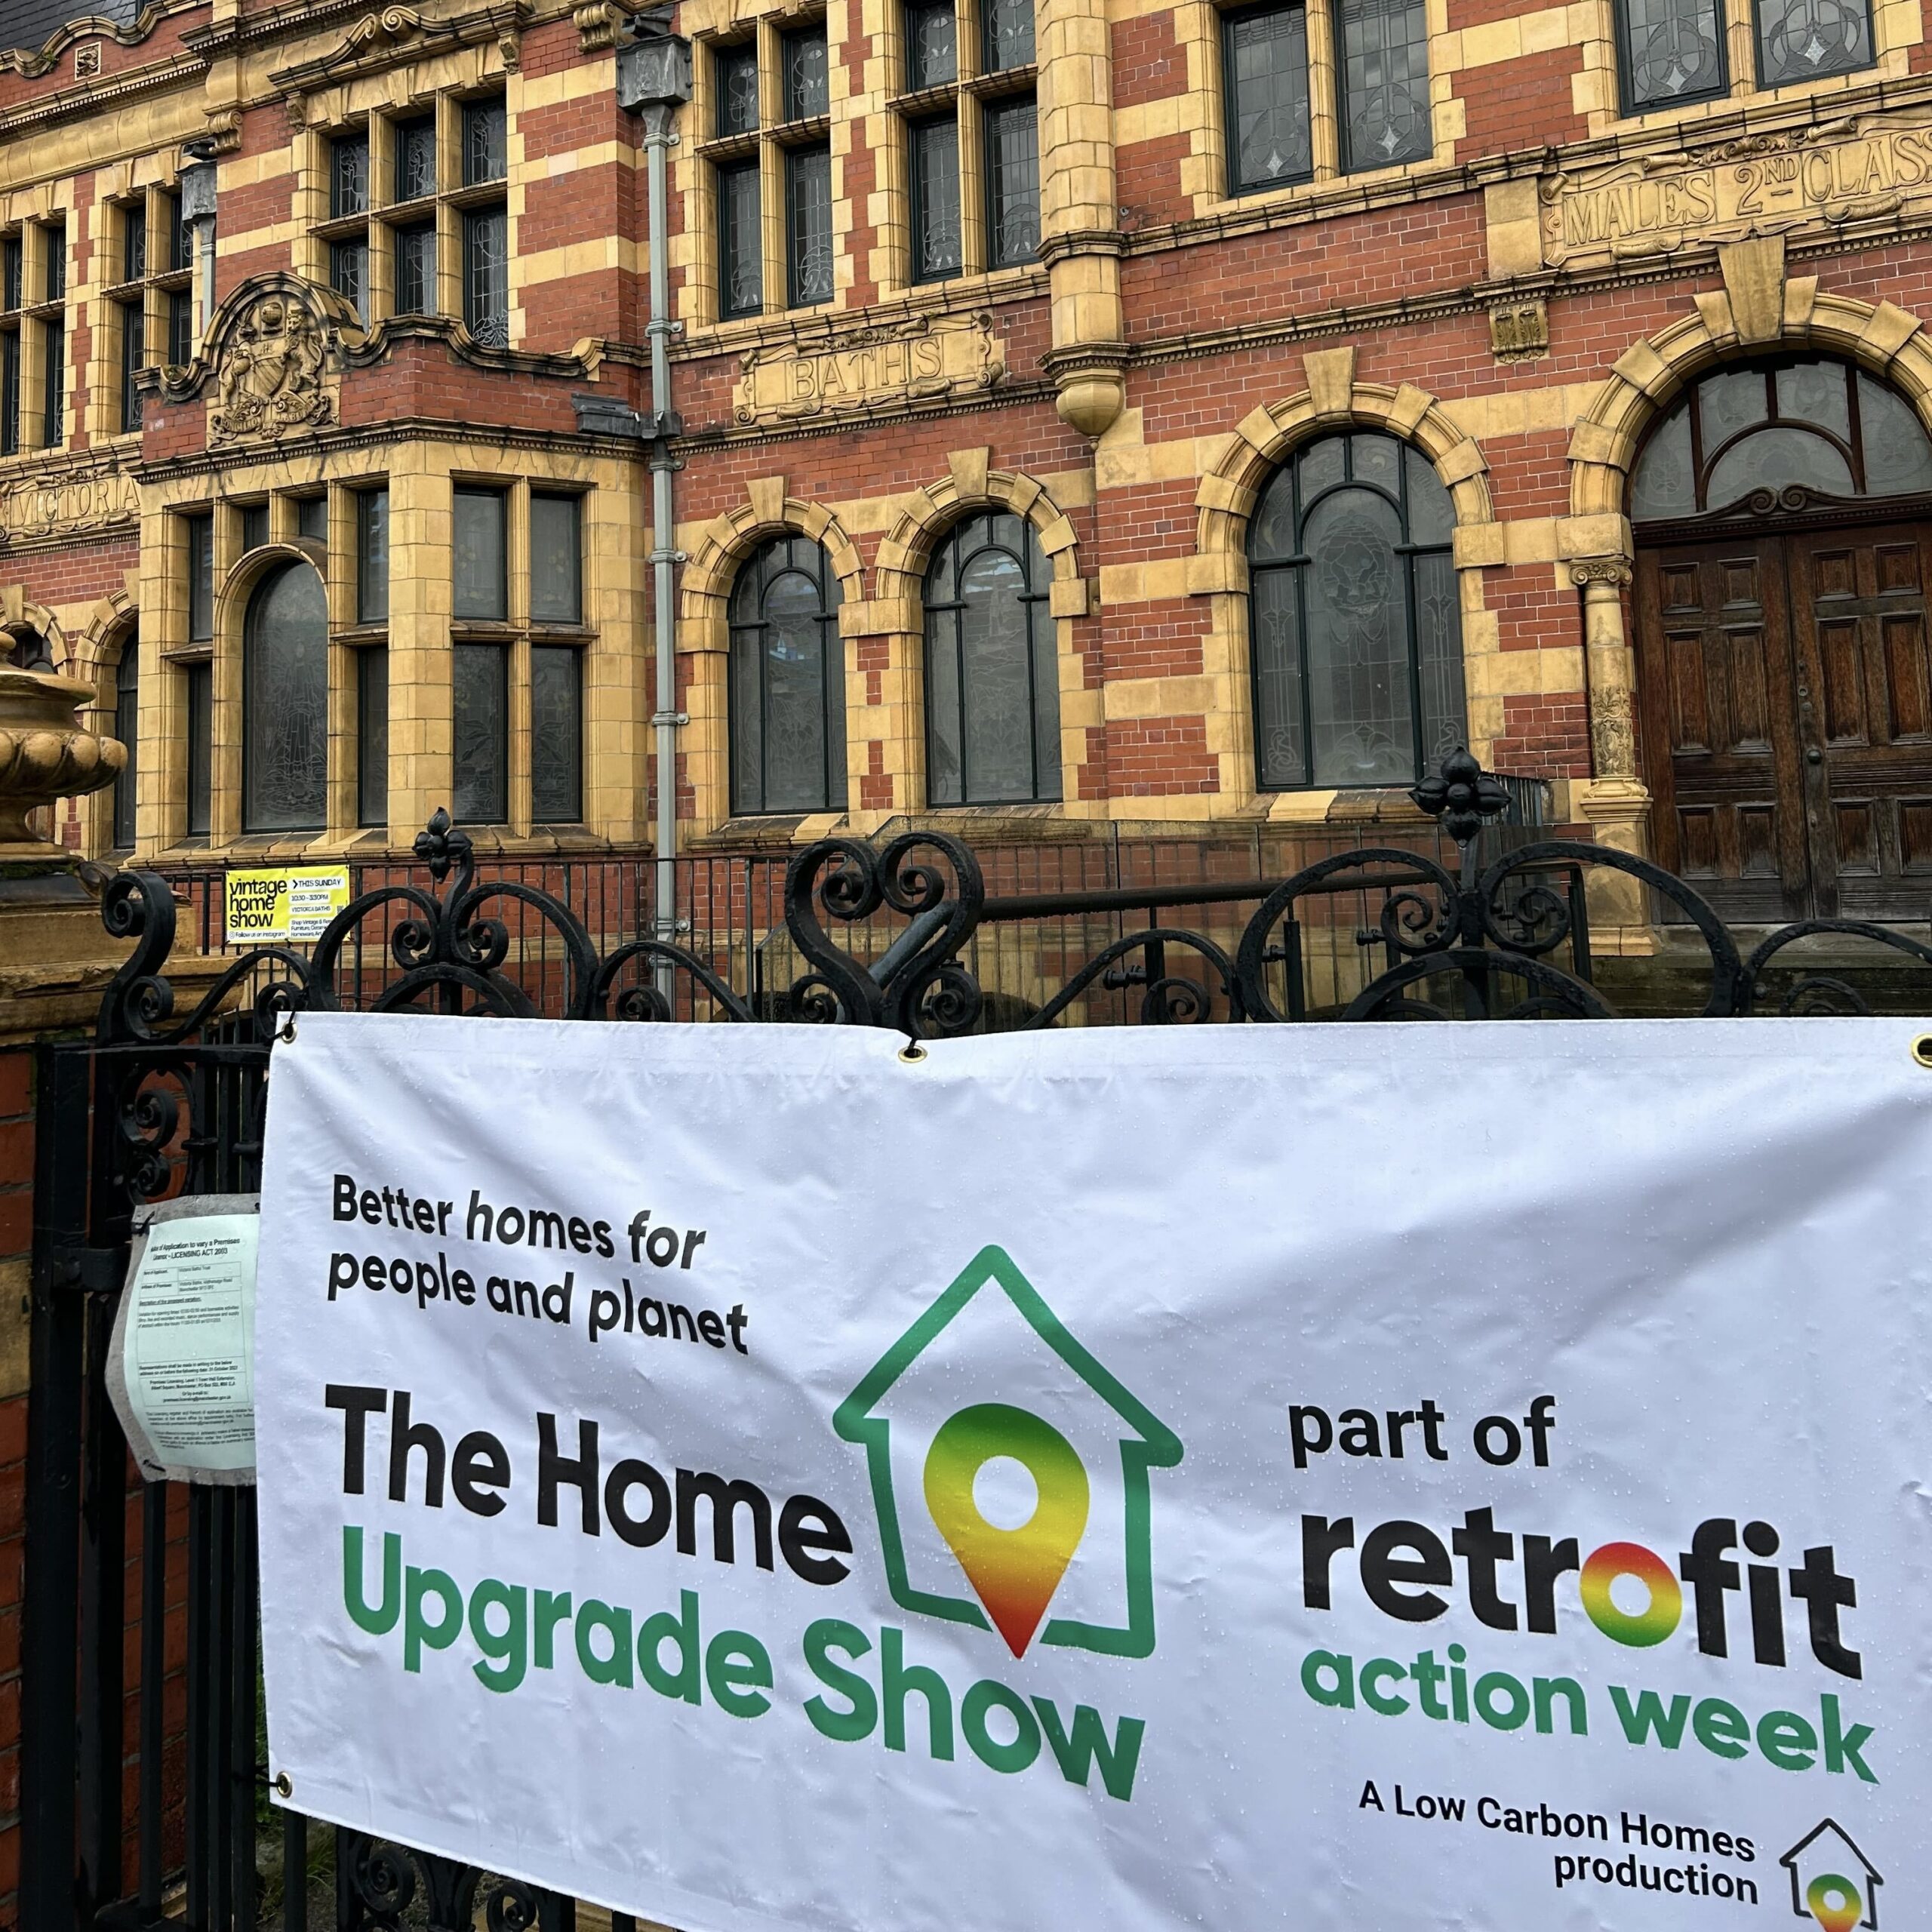
Low Carbon Homes’ Home Upgrade Show: Innovations in Retrofit
News
Data Integration and Collaboration are critical for the future of Transportation: Insights from JCT Symposium
News

uMove to support Bedfordshire Council to achieve ambitious sustainability plans
News

Active travel, the current challenges and solutions
News

Using the power of data to build cities of tomorrow
News

uMove supports the Smart Manuals for Streets programme from DfT
News

Scotland's Cycling Framework Makes Infrastructure Greatest Priority
News

Reducing emissions and improving health with active travel
Cycling Scotland

Targeting energy-efficiency campaigns to households most in need
Greater South East Net Zero Hub

Protecting an aging population from fuel poverty
Dartford Borough Council and Dover District Council

Identifying households eligible for energy grant support
The Wise Group

Facilitating active travel behavioural change with data
SEStran

Helping identify customers in or at risk of fuel poverty.
UK Power Networks
Open data promotes transparency, builds trust and empower citizens
Ireland Open Data Training
Identifying and unlocking new revenue from business rates with AI
North Lanarkshire

Tackling the growing
fuel poverty crisis with data and AI
UKRI

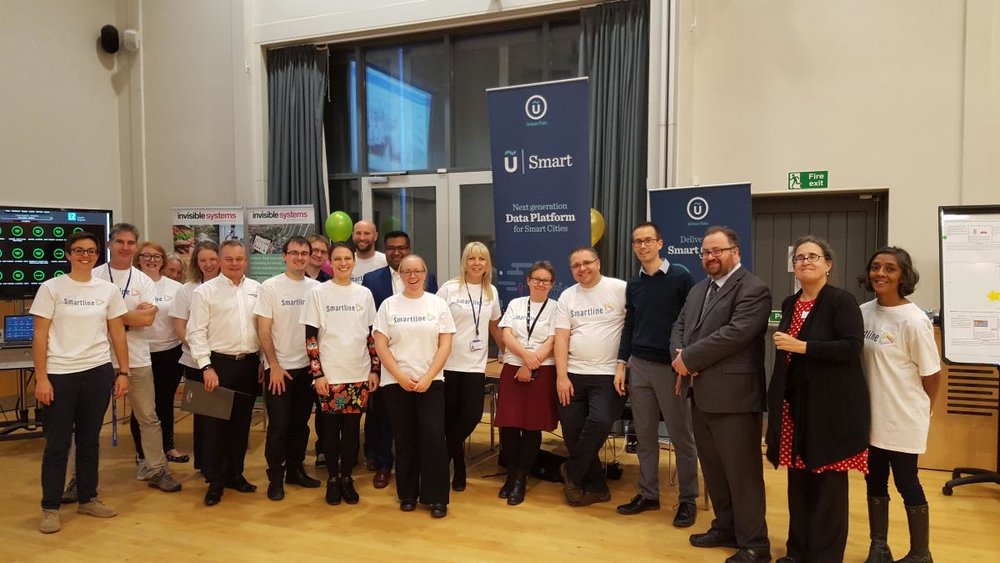
Understanding how we live and use our homes with real-time energy data
Smartline

Managing the impact of noise pollution on our cities
Noiseability

Accelerating the transformation of the UK’s energy systems
Energy Systems Catapult

Creating an integrated, affordable low-carbon energy system of the future
ReFLEX Orkney
Investing in sustainable transport infrastructure to become carbon neutral
Somerset County Council

Identifying ageing households at risk of cold and damp home
Sunderland City Council

Innovate UK funding to help our Planet Centred approach to retrofitting Europe’s leakiest homes
News

Open data is now a legal requirement in Ireland and the EU
News

New ‘uZero’ Artificial Intelligence software could help millions with their fuel bills
News
UrbanTide helps secure £48 million funding for Scottish Cities Alliance
News


UrbanTide leads £24 million program to make Glasgow a Future City
News

Building smart communities for OPEN Glasgow Engagement Programme
News

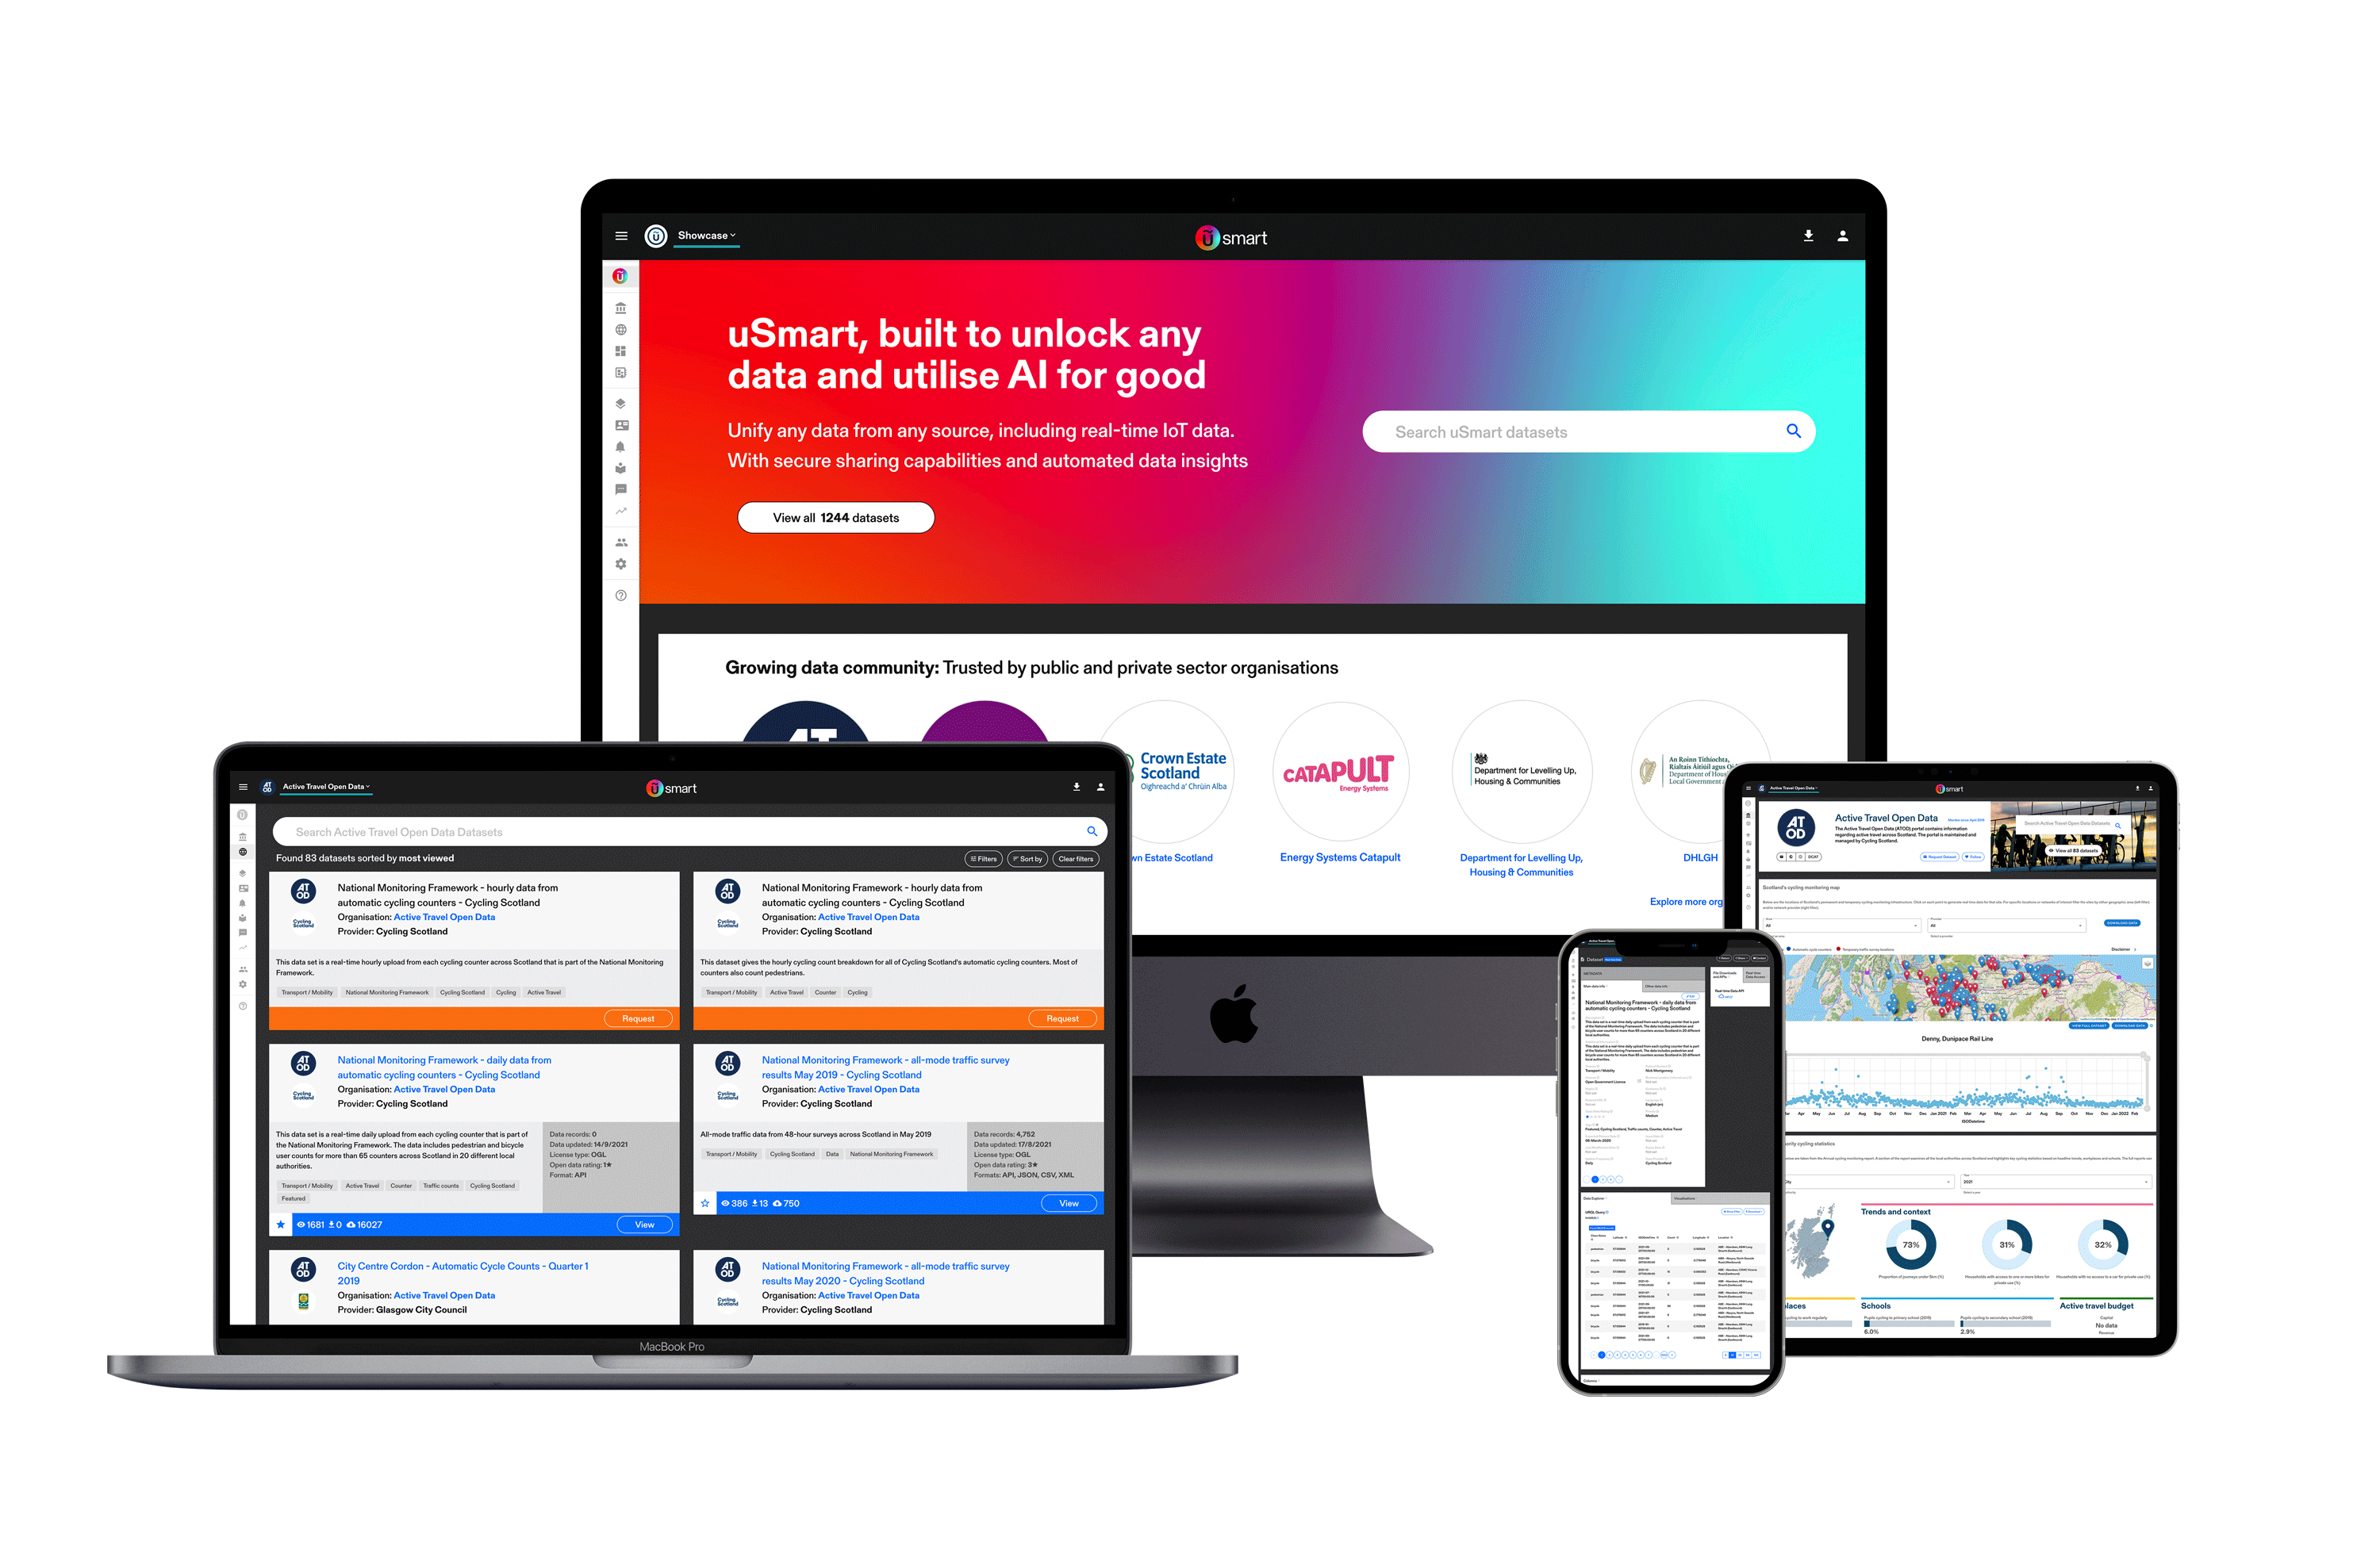
UrbanTide launches IoT data insights platform, uSmart
News
uZero announced as UKRI MEDA competition winner
News

Social Connect is a unique UK Power Networks (UKPN) innovation project
News

UrbanTide announces partnership with Energy Systems Catapult
News
UrbanTide marks four years of Open Data training in Ireland
News

Noisability: UrbanTide wins major bid as part of SynchroniCity program
News

UrbanTide joins prestigious Artificial Intelligence accelerator
News

UrbanTide recognised at ScotlandIS Digital Technology Awards
News

ODI publishes case studies that show how open data can be used in service redesign
News

UrbanTide teams up with North Lanarkshire Council to make better services with data
News

UrbanTide, Snook and North Lanarkshire Council announced as finalists for the 2018 Digital Technology Awards
News

Innovative smart communities IoT project powered by USMART
News
The Power of Data Science in the Health and Care Sector
News


UrbanTide to help transform Ireland by unlocking the power of open data
News


Stay ahead of the curve by learning more about these new smart cities standards
News

#DataFest17 - 12 key lessons we learned about smart cities, communities and the future of data
News
Emerging ideas for a renewed (Y)Our Glasgow City Centre
News


Future Health Hack - building the future of healthcare one line of code at a time
News
Meet our API Data Explorer – aka your new best friend if you are working with big data
News

Car parks ‘extinct’ in smart cities of the future?
News


3 awesome USMART features - with more coming soon!
News

Data scientists and USMART: a match made in heaven
News

We are now Regional Supporters of Open Data Impact Map
News


Next generation open data platform looking for beta testers!
News


Glasgow city centre regeneration - how smart can Glasgow be?
News

Open data - is the open private sector the next frontier?
News


Open data everywhere! Review of open data maturity in Europe, UK and Scotland
News

Feedback from our year delivering open data training for Scottish Government
News

Announcing our new open data training programme
News


Glasgow City Centre District Regeneration Frameworks
News


Metadata and metadata standards- reflections from our Chief Operational Officer
News


All about our Smart Cities Maturity Self-Assessment Tool
News

Open data training for Scotland's public sector
News

Engage - invest – Exploit (EiE) or Enjoyable - interactive - Experience (EiE)
News


UrbanTide and India: 5 Lesson's Learned from Simon's Trip to the Subcontinent
News

Cisco and the Smart Cities Council: 4 Messages from America...
News

Edinburgh continues to iterate, and then iterate again
News


Start your journey
Take a look at our product page to find out which UrbanTide AI tool has been designed for your needs.
Find out how we can support your data and AI projects and see our growing AI portfolio in action.